
Most distributors I talk to can tell me how much traffic their website gets. Very few can tell me how many of their own reps opened a spec sheet last month.
That gap matters more every year. Gartner found that 61% of B2B buyers prefer a rep-free buying experience. When a buyer does give your rep time, the rep has to bring something the website can't: the right answer, from the right line, in that conversation. If they can't find it, they promise to follow up with a quote, and the selling stops there.
So the useful question isn't "do we have the content?" It's "are our reps using it, and which of it?" Here are the sales enablement metrics I'd track, whether you're a distributor carrying 20 lines or a manufacturer selling through 200 distributors.
Start with one definition: what counts as an active rep
Before you track anything, agree on what "active" means. The definition I use is simple: a registered user who logged in at least once in the previous month, on the web or on their phone.
It's a low bar on purpose. You're not grading reps yet. You're finding out who has the tool in their routine and who has never opened it since onboarding. Once you have that line, you can split the inactive group into two very different problems:
- Never activated: they got an invite and never logged in. That's an onboarding problem.
- Drifted off: they used it, then stopped. That's a usefulness problem, and it's the one worth a conversation.
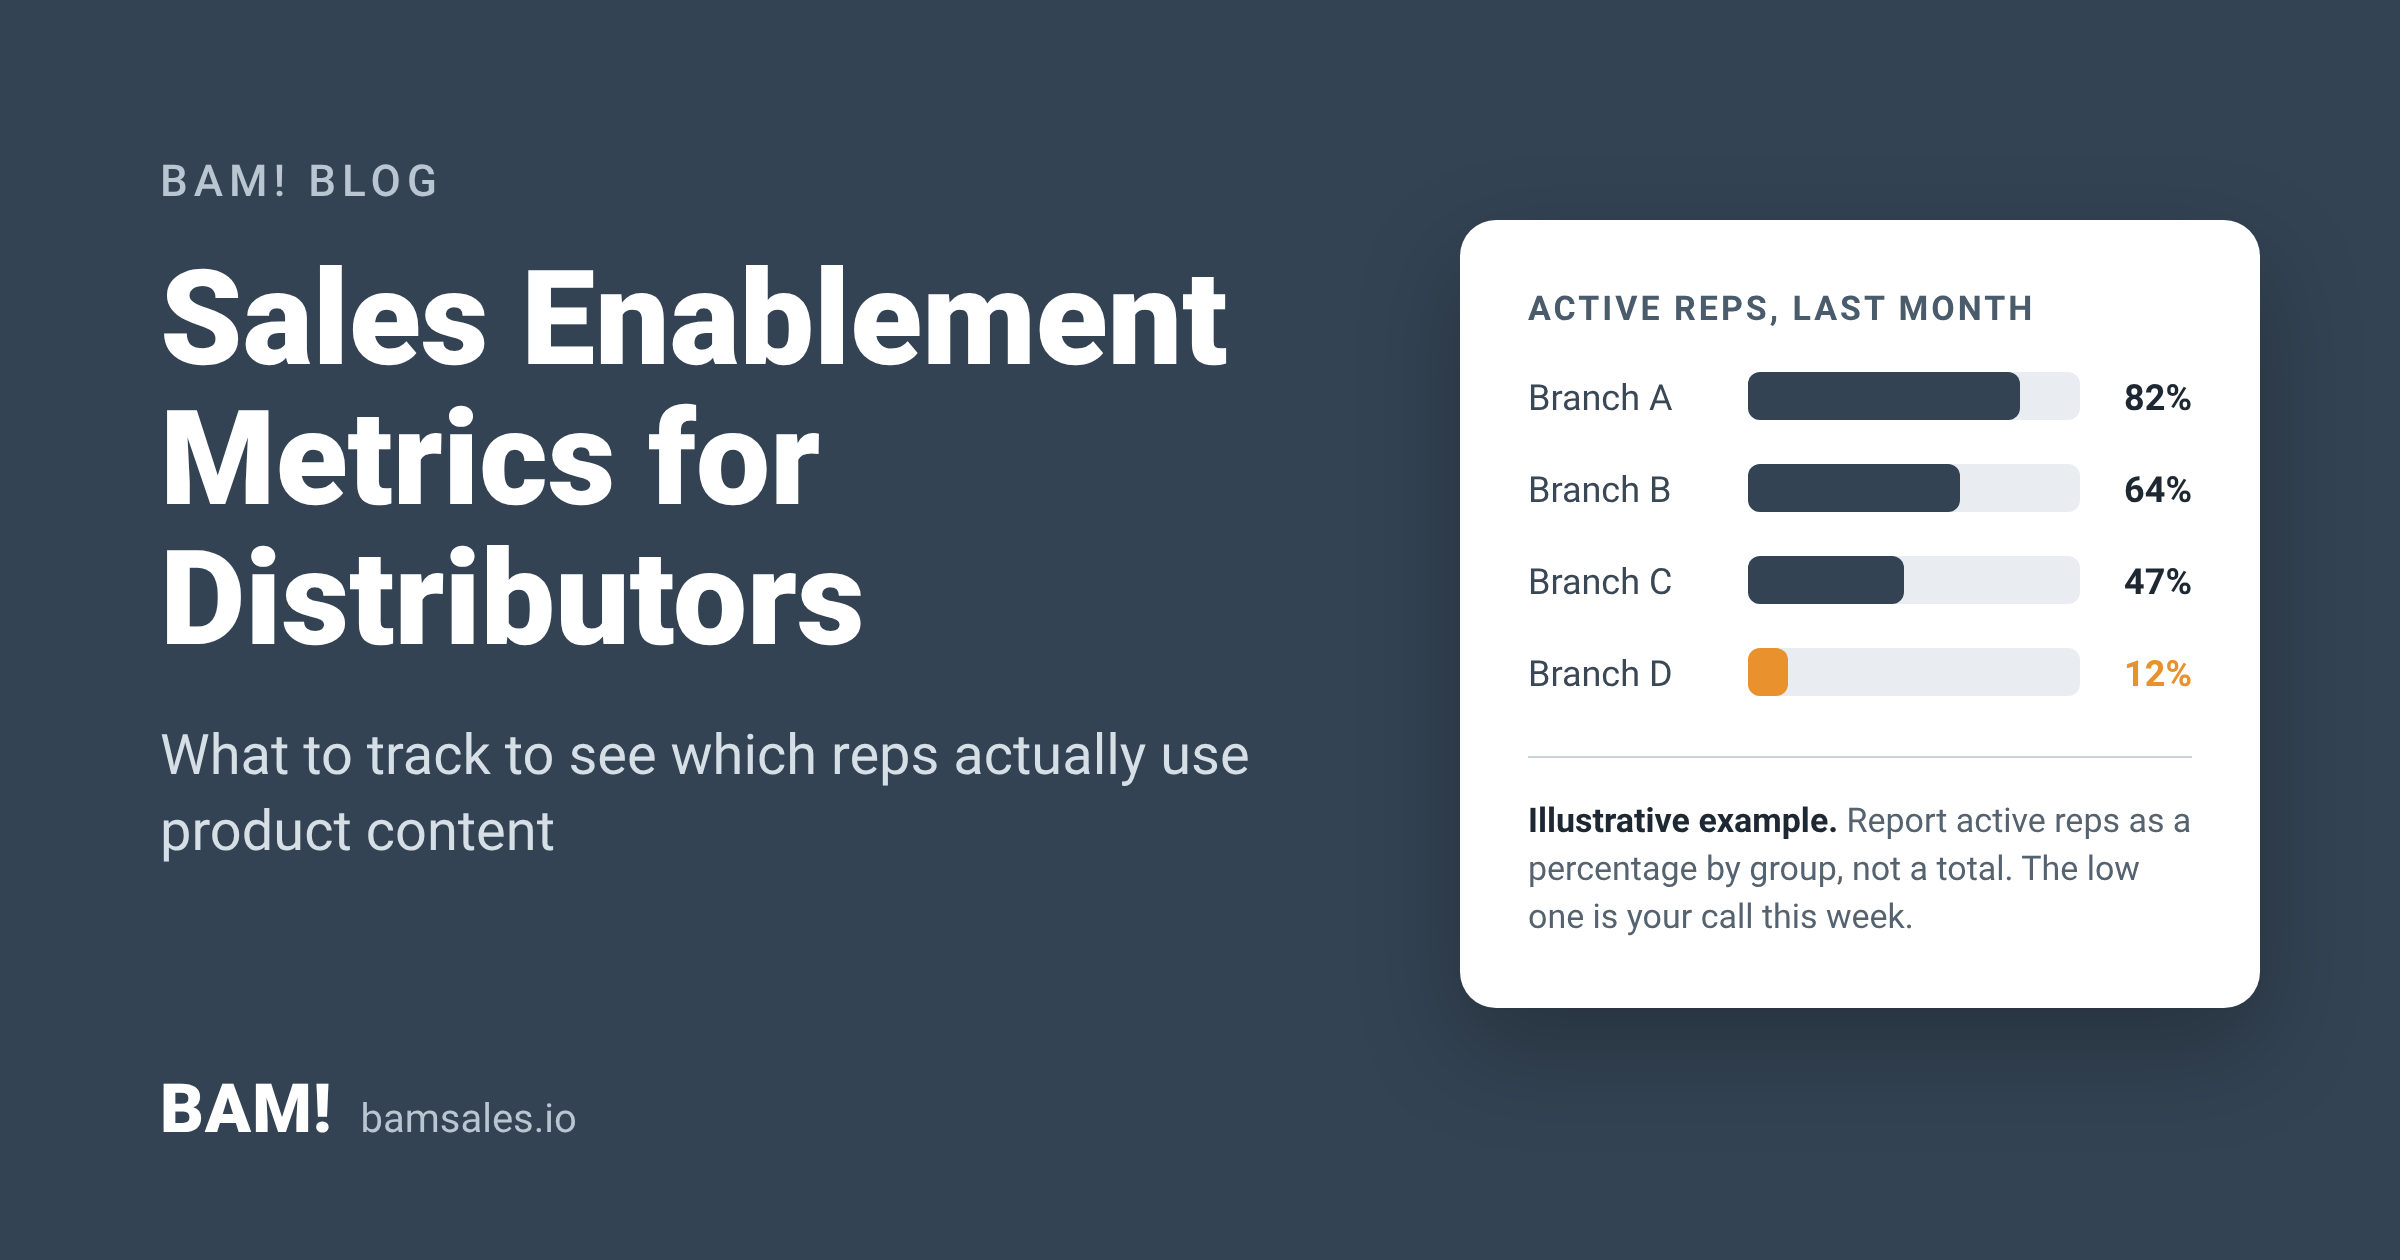
Report active reps as a percentage, by group
A total like "140 active users" tells you very little. Is that 140 out of 150, or 140 out of 900?
Report the active percentage instead, and break it out by the groups you actually manage:
- For a distributor: by branch, region or sales manager.
- For a manufacturer: by distributor, with all of that distributor's locations rolled up into one number.
That rollup step is where most reports fall apart. One distributor with six branches shows up as six small accounts, and none of them looks important. Group them under one parent and you can see that your third-largest partner has 12% of its reps active. That's a call worth making this week.
Track what gets used, and what gets searched for and isn't there
Usage by asset tells you which content earns its place: the brochures, videos, spec sheets and calculators reps open and share with customers. Sort it by line. If you carry 20 OEM lines and three of them get almost all the activity, that's either where your reps are most confident or where the content is easiest to reach. Usually it's both.
The more useful signal is the one most teams never look at: what reps searched for and didn't find. A search for a model number with no results is a rep standing in front of a customer without an answer. A short monthly list of failed searches is the best content brief your marketing team will ever get.
Two more things to watch:
- Shares: content a rep sent to a customer is content that did its job. It's a better signal than views.
- Age: when was each line's content last updated? If a manufacturer changed a spec in the spring and your reps are still opening last year's PDF, the usage number looks fine and the answer is wrong.
Read the numbers once a month, then talk to reps
Dashboards nobody reads don't change anything. What works is a short report on the first or second business day of each month: active percentage by group, the trend against last month, top content, failed searches, and two or three recommendations. Then review it in a standing meeting, not an email thread.
The numbers tell you where to look. They don't tell you why. I've seen sales teams with heavy website traffic whose own reps barely use the tools. The fix there wasn't another feature. It was asking the reps one question: "What would make you open this every day?" Then testing the one thing they asked for, instead of rolling out the whole catalog.
Adoption is earned in the field. The metrics just tell you where it's happening and where it isn't.
What manufacturers should ask their distributors for
If you sell through a channel, you have a stake in all of this, but you usually can't see it. Your content leaves your portal and disappears into a distributor's shared drive, and you never learn whether a rep opened it.
Ask your top distributors for three numbers each quarter: the share of their reps who used your content last month, your top five assets by use, and anything their reps looked for from your line and couldn't find. The distributors who can answer will be the ones selling your line. The ones who can't are where your channel team should spend time.
What to do this week
- Write down your definition of an active rep, and share it with whoever builds your reports.
- Pull last month's active percentage by branch or by distributor, with locations rolled up.
- Find the three groups with the lowest percentage and ask one rep in each what would make the tool worth opening daily.
- Pull your failed searches for the last 30 days and send the list to marketing.
- Check the last-updated date on content for your top five lines.
This is the problem we built BAM!-D around: one branded app with content from every line a distributor carries, with the usage data to see what reps actually reach for. If you want to see how it works, watch the 40-second walkthrough.